Klue Compete
The Competitive Enablement Platform
Learn More
INTRODUCING KLUE INSIGHTS
FIND OUT MORE >


It’s time to acknowledge the elephant in the room.
Identifying competitors in deals. It’s tough to collect.
Unless sales leadership is on board with the importance of this intel, it’s not going to be a priority. On the other hand, if you have this data readily available, you can pull powerful insights and optimize revenue for the business.
We’re going to show you how you can use this data to find out where you’re losing deals to competitors and to help make better decisions on where to spend competitive intelligence resources to have the biggest revenue impact on sales performance.
Let’s start with the basics. Before we deep dive into a full deal profile against a competitor, we need to identify where you stack up against your competitors and which are the ones to watch.
At this point, you need to discern not only which competitors you lose the most deals against, but what that equates to in lost revenue.

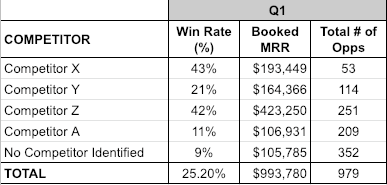
Start by tracking the three basic competitive sales metrics against each competitor: win-rate, booked revenue (MRR in our case), and total number of opportunities. Track these metrics quarterly (at minimum). If you end up spending significant amounts of work improving win rates against particular competitors, you will find monthly tracking will give you a better pulse on the immediate impact of those efforts.
Compiling the numbers is the easy part. Figuring out the story behind what’s influencing those numbers is the work that actually matters. We’re going to walk through a few examples to share how we would break down these sales metrics.
The best analogy to performing this type of branch-logic analysis is to think about peeling back the layers of an onion. You start at the highest level of analysis; the big picture. You’re looking for general themes or stories from the data. The next step is to identify the drivers behind these numbers. What factors could impact these results? By identifying a list of possible drivers, you now have a list of questions you need to answer in order to understand what’s actually happening in your pipeline.
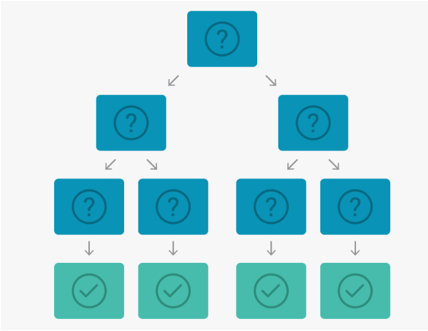
Each of those drivers, depending on their complexity, can unravel a new set of questions.
Keep peeling back the layers, only to the depth necessary to answer your key questions:
– How do we stack up against our competitors in deals?
– Which competitors have the biggest impact on our revenue?
– Who should we focus on improving our win rates against to drive the largest marginal revenue to the business?
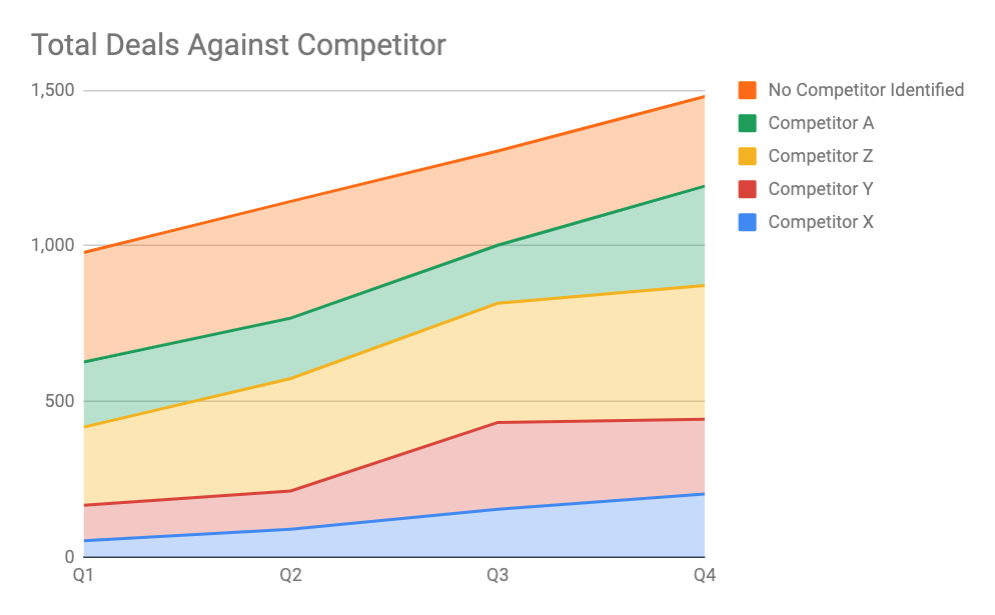
The first step in your competitive sales analysis is to get an understanding of who your sales reps are facing off against most frequently. Tracking this metric over time tells you which competitors are coming up more often in deals, and which are appearing less frequently.
In the example below, Competitor Z appears to be the most significant competitive threat. They have been appearing in deals more and more frequently over the course of the year. Could this be because they have tweaked the type of accounts their BDRs/SDRs are prospecting towards? Could they be a fast-growing company that is picking up steam and gaining awareness in the market? Could significant product improvements have led to their growth? These are the sort of “drivers” you want to identify and then research further to get a better sense of what’s happening with this company.
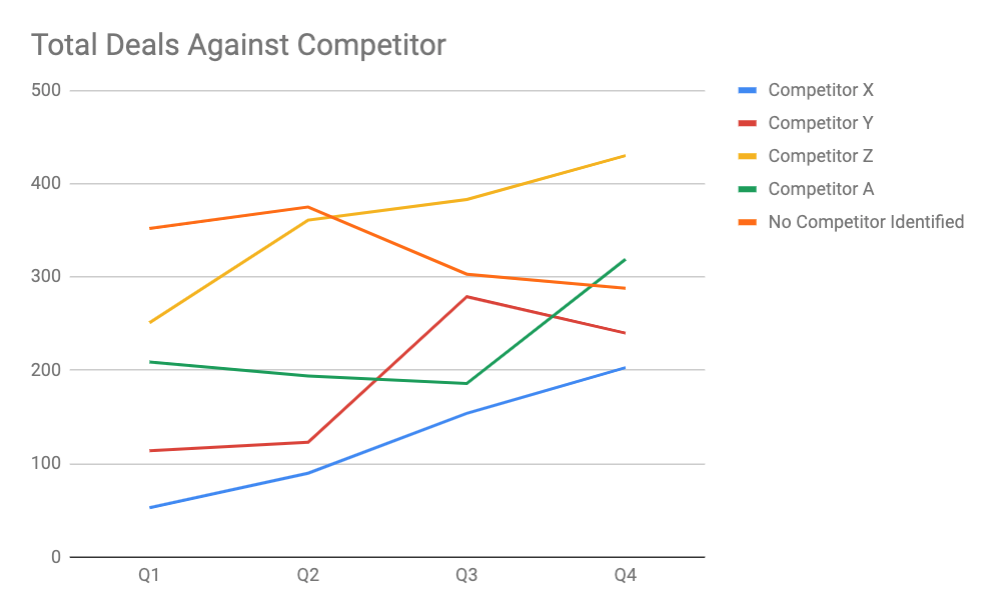
Over the course of the year, the number of deals where no competitor was identified went down. It’s hard to tell if the increase in deals against Competitor Z is because you really were facing off against them more frequently, or whether they are just actually being identified more often. By converting this chart into a stacked line graph (below) you can see that overall the total number of deals has consistently increased QoQ, and that Competitor Z appears to have had the largest increase in the number of deals since Q1 – a 52% increase in Opportunities (Opps) whereas total Opps increased by only 33%.
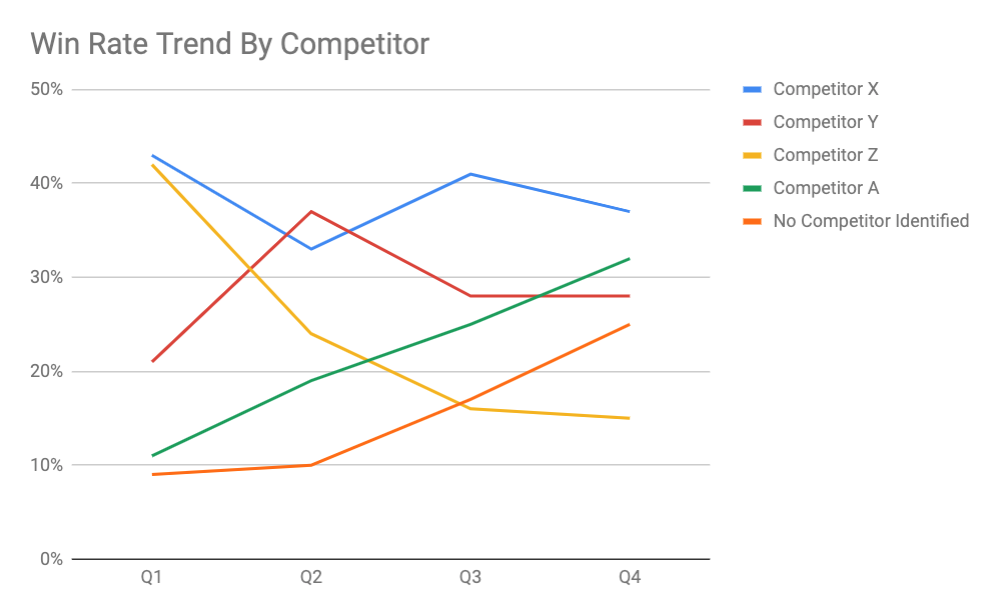
Tracking the trend in your win rate against each competitor is a great way to see the impact of your competitive enablement efforts (playbooks, sales battlecards, competitive sales training programs, etc.). This measure is really telling you – when up against my competitor – how often do I win?
Beyond your competitive enablement program, there are more things that factor into your win rate – internal drivers including your product, marketing campaigns, and sales acumen. However, external drivers including your competitors’ product, their sales, and marketing strategies (who do they target? New geos? New teams? Focusing on SME vs Enterprise?). All of these can factor into your ability to close these deals.
In the example below there are a few interesting stories being shared by the data. The win rates against Competitor X and Competitor Y have fluctuated over the year, but on average seem to level out. Win rate has consistently increased against Competitor A, and decreased significantly against Competitor Z. Are these concerns?
While your win rate has increased against Competitor A, referring back to our competitive frequency chart, they’ve also been coming up more and more in deals. This is a positive sign. You’re facing off against them more frequently but also learning to effectively navigate those deals as time goes on.
Competitor Z is a different story. Not only have you been facing them more frequently in deals, but you’re actually losing to them more often over time. Something is afoot. Is this a product issue? Do your reps have the support and training they need to deposition effectively during the sales cycle?
Here you will want to list all possible drivers of decreasing win rates and start to explore. Ways to uncover further information can include win-loss analysis, building product and feature comparisons, and by evaluating the sales enablement and competitive battlecards your reps have access to. Are the competitive content (ie. sales battlecards) and training programs effective and being completed? You can read more about how to measure the effectiveness of your sales battlecards in this post.
Finally, to put all of the previous metrics into context we need to understand the total revenue being impacted by each of your competitors. How much revenue is being won against different competitors, and how much is being left on the table from lost deals?
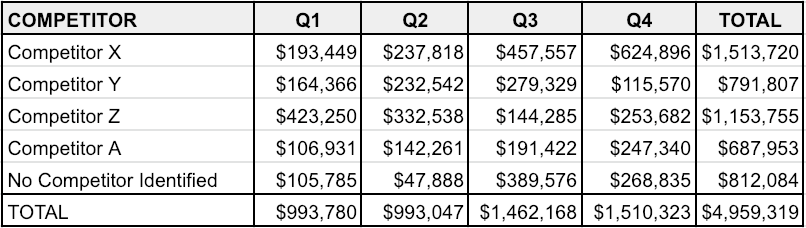
Just as it sounds, roll-up the total revenue booked each quarter in deals faced off against each competitor. The total revenue booked against each competitor tells you how important winning against each competitor is to your bottom line.
Put into practice, let’s take a look at the surprising story we can now see about Competitor X. Deals against Competitor X account for the highest amount of revenue for your business. They are a very important competitor to beat.
However, we never would have understood the importance of deals against this competitor until we looked at this metric. They account for the lowest number of opportunities, and the sales team has held a mostly consistent win rate against them. Now we can tell that the average deal size in opportunities against this competitor must be very large. This might be a competitor that is faced only in enterprise-level deals – so while it doesn’t seem like it’s an important competitor to beat by win rate or number of Opps alone, we can finally see this competitor in a new light.
Competitor Z accounts for the second highest revenue for the company. Given the last two metrics we’ve looked at, and the decreasing win rate against them, intuitively it seems that improving the win rate against this competitor could have a sizable impact on revenue.
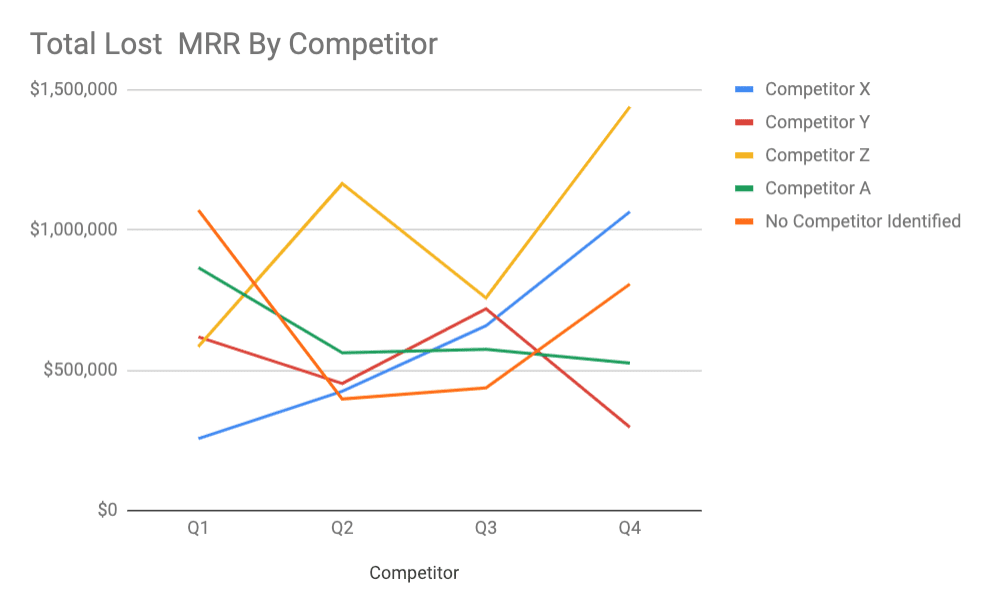
Lost revenue looks at the unrealized revenue from lost opportunities against each competitor. This is what you could have made if you closed more deals. This helps to show you the total revenue opportunity of each competitor. In this case, both Competitors X and Z have the highest value of lost revenue.
This information is important because it helps with the next metric – the final step to quantifying which competitor’s deals have the highest revenue opportunity.
If you have limited resources to spend to improve your reps’ ability to sell against a competitor, you need to know exactly where to spend that effort. To do this, we calculate the marginal return on a 1% increase to win rate against each competitor.
This tells us how much marginal revenue could be booked if we’re able to increase win rates against each competitor by only 1%. By comparing the marginal return against each other, you are able to quantify where you will get the highest ROI on your competitive intelligence resources.
To calculate the marginal return on win rate you need to determine the average revenue per deal (in this example we used average MRR) which is found using the calculation shown below (or you can download this spreadsheet template).
After that, you’ll also calculate the total number of lost deals against each competitor and the total lost Revenue (Lost MRR in this example) which we found in the previous step.
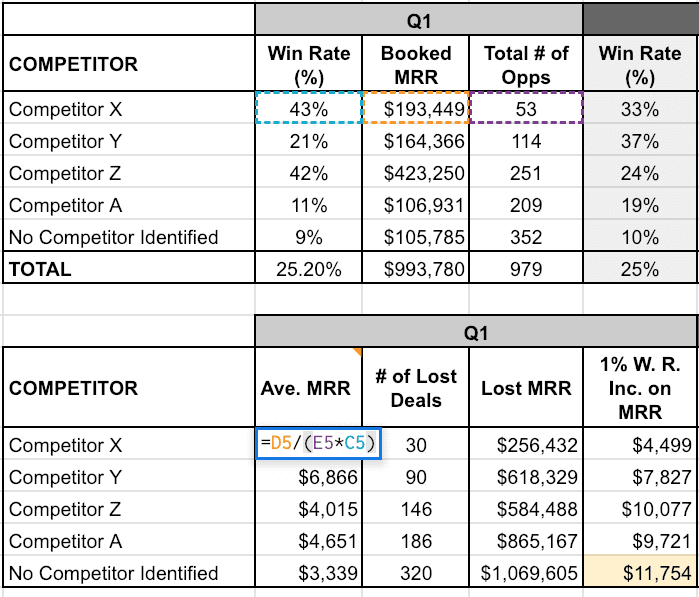
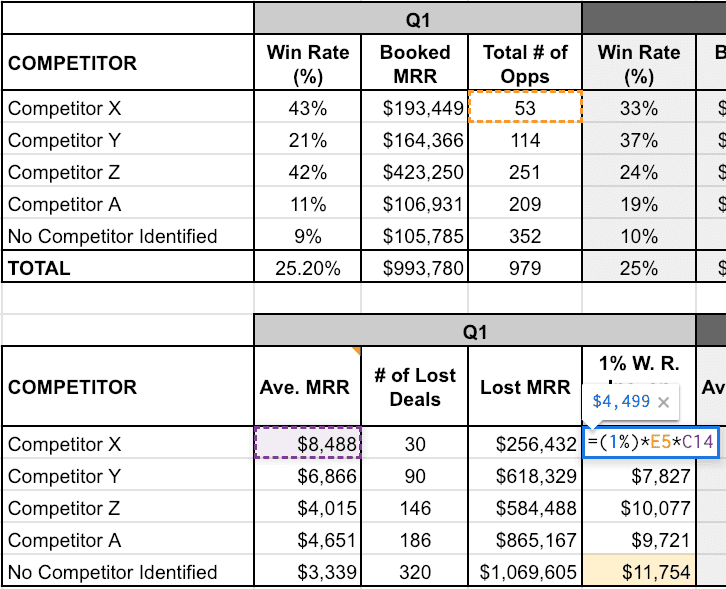
Finally, you’ll calculate the actual marginal return by taking 1% of the total deals multiplied by the average revenue per deal.
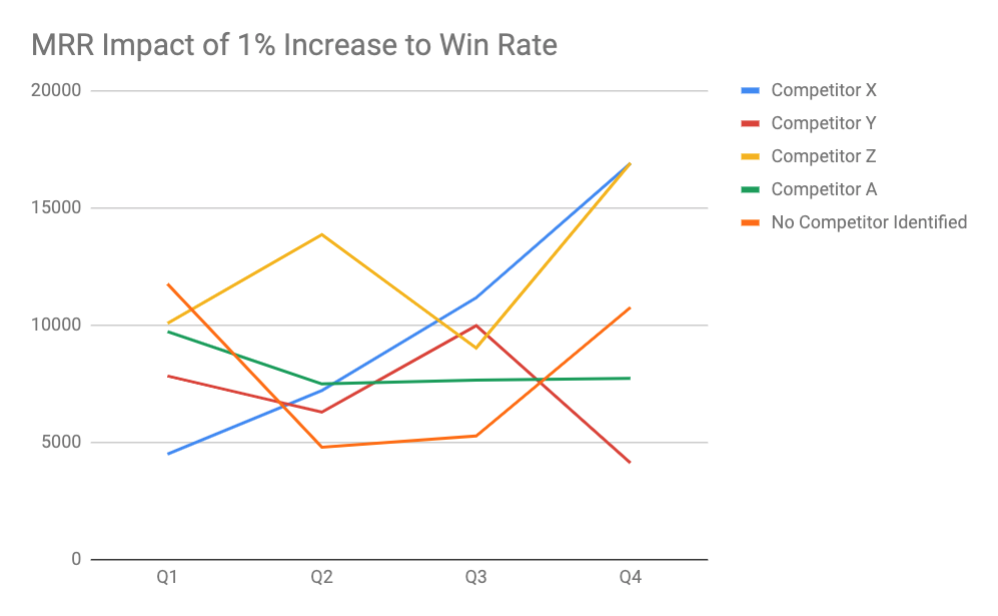
Plotting the marginal return on win rate in the graph below, we can now finally see where the biggest revenue potential is in improving win rate … with Competitor Z (full results in the template here). In a completely quantifiable analysis, you’ve been able to determine where your competitive intelligence efforts could have the largest impact on the business.
If you’re sad this article was too short (hah!) don’t worry, there’s more coming your way!
This was only Part One of a two-part series on competitive sales analysis. Next post we’ll be taking your top competitor and doing a complete dissection of these deals to help you pinpoint exactly where and why you’re losing.
Download the competitive sales analysis template from this article, and we’ll send you a notification when Part Two has been published.
The goal with this next article is to help you to get laser-focused with where and how you’re going to spend efforts improving your win rate against a competitor – is it within a specific stage of the deal cycle? Is it with prospects in a specific vertical or of a specific firmographic makeup?
This competitive sales analysis is intended to make you and your company more strategic at how you approach your competitive intelligence, and how you use it to win more deals.

Competitive Enablement
The topic of Large Language Models (LLMs) has a lot of confusion. Here's what you need to know about how Klue is working with them.

Competitive Enablement
Product Marketing
If your competitive intel game is too strong for automation, too pure for data privacy, and too rebellious for accuracy — then Klue AI is probably not for you.
Let’s do it. Tell us a bit about yourself and we’ll set up a time to wow you.
Let's do it. Tell us a bit about yourself and we'll set up a time to wow you.
XLet's do it. Tell us a bit about yourself and we'll set up a time to wow you.
XSubscribe to get our latest AI functionality and news in your inbox.
XOur Buyer Pulse feature, set to launch in Q2 2024, offers valuable insights into the factors influencing buyer decisions in your pipeline. By signing up for the waitlist, we can better gauge interest and proactively engage with you to streamline the setup and integration process before the feature becomes widely available.
X