Klue Compete
The Competitive Enablement Platform
Learn More
FIND OUT MORE >

Trying to run competitive intelligence without reporting metrics in place is like canoeing without a paddle.
I mean, technically you can do it. But it’s going to suck. And you’ll likely be spinning in circles for hours on end.
The results from our 2022 Competitive Enablement Report show that a surprising amount of competitive programs don’t have any reporting metrics or KPIs currently in place. In fact, 54% aren’t reporting on or measuring performance at all.
This is not a winning recipe. There are two main reasons why your program needs to have reporting metrics in place:
Without any reporting in place, you’ll have no idea as to which competitors are disrupting you the most and what they’re doing to cause this disruption.
Your competitive program is only as good as the results you can attribute to it. The absence of coherent reporting metrics makes it impossible to measure your program’s impact on the business.
And guess what? If you tick both of these boxes, then you’ll be in a far better position to get support from execs the next time you present what your competitive program has done for the business.
In this article, we look at two companies, Saviynt and Symphony RetailAI, that implemented reporting metrics to guide the direction of their competitive efforts and measure their impact on revenue to get greater executive support.
How do you decide what competitors you should focus on?
Some programs decide to zero in on whatever competitor the sales team are voicing the loudest concerns about. Others will look at whoever is popping up in the biggest deals.
And, frankly, a lot don’t have any idea where they should start.
When building out their competitive program, Saviynt was in that very situation. They had hundreds of competitors in different markets, but weren’t certain on who was impacting the business most. In order to find out where to begin, they outlined what their competitive landscape looked like with a ‘Threat Analysis’.
“The first stage is getting a base understanding of what your competitive landscape looks like. What’s our win-rate rate? What’s our conversion rate? Who are we really competing with and what level of understanding do we have of these competitors?” said Chris Owen, Director of Product Management.
They pieced this together by digging into their Salesforce data. This bubbled up what competitors were appearing most frequently in deals, what their win-rates were against them, and the size of the deals they were involved in.
With this information, it gave the team a clear line of sight of where their efforts should be directed.
“You can’t argue with data. Our analysis showed: this is our win-rate, these are the markets we exist within, and this is who we compete with.”

This reporting analysis allowed Saviynt to be more efficient and prioritize their research on the top handful of competitors that had the biggest overall revenue impact. They could then move forward to gather the existing intel on these competitors and figure out where the knowledge gaps were.
A clear visual like this Threat Analysis also had the added benefit of strengthening the business case for the competitive program at Saviynt. Based on the total number of competitors Chris’ team uncovered and the existing knowledge they had on them, they were able to show that there was roughly a 60-70% knowledge gap on the market.
In short, there was a lot of competitive enablement that had to be done.
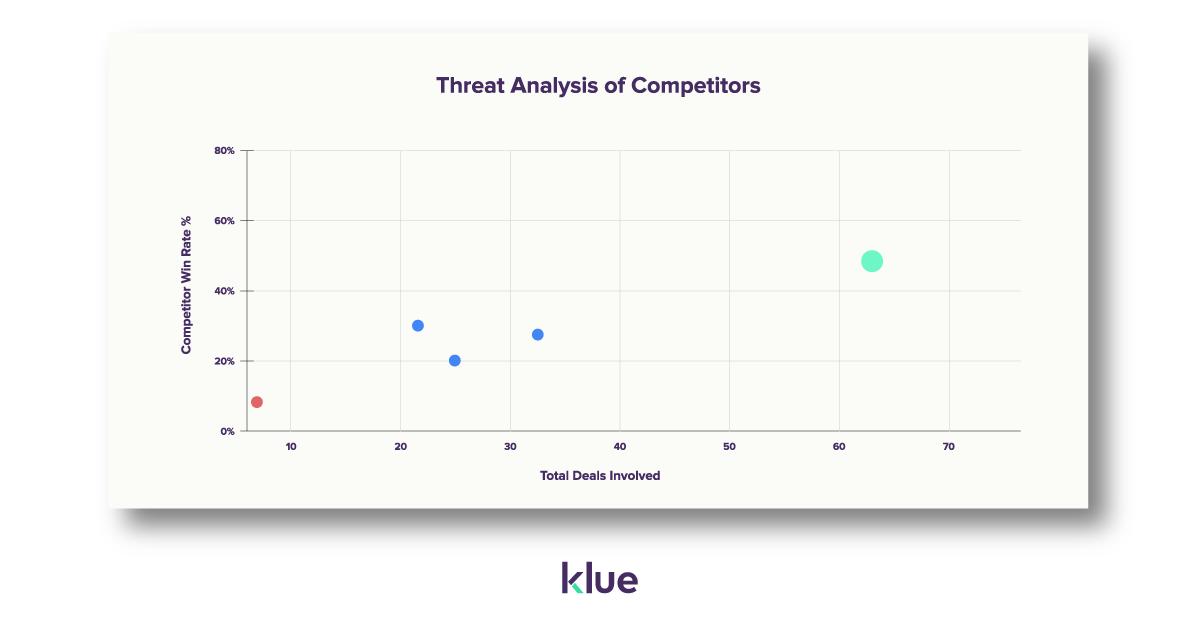

Using this chart to map out your biggest competitive threats isn’t just a starting point.
Updating the changes over time on a quarterly or annual basis allows you to report on trends. You can measure how your efforts minimized the inroads a competitor has made on your revenue, or present the warning signs of an emerging threat that needs to be addressed.
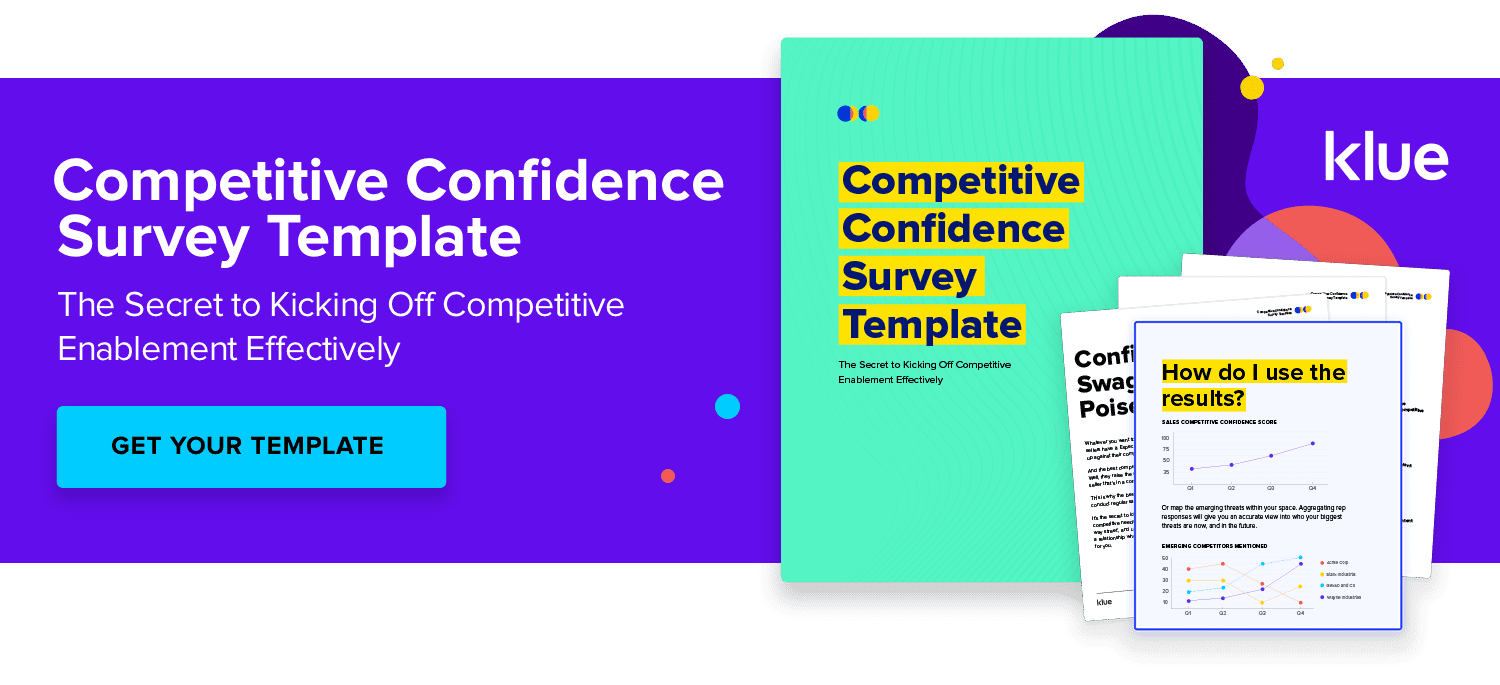
An even simpler reporting metric that measures your competitive program’s impact and identifies where your enablement efforts should focus is by regularly gauging your end-user’s level of confidence and knowledge on different competitors. We like to call it the competitive confidence survey, and you can grab your own template right here.
Saviynt ran this by competitive confidence survey with their internal teams to benchmark the starting point of their competitive understanding. With a benchmark in place, they could then track knowledge improvements over time amongst different teams. This allowed them to measure one of their core KPIs which was to have a stronger organizational understanding of their competitive landscape.
“One of the first things we did was survey the user-base. We sent out a survey to our sales and pre-sales to get an understanding of where they felt their knowledge is at from a competitive standpoint.
This is something we’re going to run every three months, just to be able to track as a metric, to show that our KPIs are actually working, and that people’s knowledge on different competitors is actually improving,” Chris said.
This internal survey feedback is a way to quantify anecdotal comments and track how well you’re enabling users on the competition. But, the results will also inform what you need to do next.
A sudden dip in sales’ confidence against competitor X? It’s time to dig into what’s changed that’s sewed this doubt.
Reps are loving the way you crafted an objection handling battlecard on competitor Y? Take the strategies you used in that piece of content into your next battlecards on other competitors.
Survey feedback creates a natural back-and-forth between those in charge of competitive enablement and the consumers of this intel. Ultimately, your content should always have these end-users in mind.
In Saviynt’s case, there was a clear desire from end-users to get a better understanding of the broader market. With this knowledge, Chris’ team scheduled out a weekly competitive intelligence newsletter with relevant news of what was happening in their space. It was a concise summary that people could consume passively when starting their work day or on a lunch break.
The team at Saviynt could now also report on open-rates, reading time, and click-through rates of these digests to gauge how much their users were engaging with the content.


It’s no secret that it can be a challenge to isolate the revenue impact of a competitive enablement program.
Meanwhile, sales performance is easily measured by revenue metrics on a consistent basis. It’s one of the biggest reasons why supporting sales first helps you tie a dollar value to your competitive intelligence efforts.
However, not all reporting metrics are created equal.
The goal for a competitive program is to enable end-users with intel that helps them in a deal.
With that in mind, a clear starting point for reporting on this is to track that end-users are actually using the content you’re providing. An example of this would be open rates, click-throughs, and reading times of Saviynt’s weekly digest newsletter.
But content consumption isn’t enough to prove that your competitive efforts are impacting the bottom line.
Symphony RetailAI knew this when building out their competitive program. In order to get executive support for their program, they needed to prove that they were influencing revenue.
A starting point to doing this is by tracking competitive win-rates, and how that changes over time.
An improvement in your sales team’s performance quarter-over-quarter against your three primary competitors can make a case for the influence of your competitive program.
But… even then, that’s not an exact science.
Let’s say that Claire happened to crush her quota last quarter. Is that because of the competitive intel she was using? Not necessarily – she might’ve built a stronger rapport with prospects or the product she’s selling rolled out a great new feature.
So, to truly identify the impact of your competitive enablement program, you need to take your reporting a lever deeper, and pull together these pieces…
An even more accurate way to measure the value of competitive intel being provided is to look at the lift in the performance of your sales reps that use the content and battlecards provided versus those that don’t during competitive deals.
Symphony RetailAI used this measurement as a core reporting metric to measure their efforts. However, they went even further and used an ‘Impact Analysis’ to attach a dollar amount to this measurement.
So, how do you do this?
Let’s say a sales reps that uses your battlecards on a competitor won 45% of their deals, but the reps that don’t use your battlecards only closed 36% of their deals.
Sure, a sales rep not using your battlecards being 9% less likely to close deals seems somewhat significant. But how much does that impact revenue over an entire year if your reps face 55 competitive opportunities per quarter and your average deal size is $200,000
In this example, by measuring the performance of sales reps that used competitive intel against those who didn’t, you can attribute $3,960,000 of lost revenue to teams not using competitive intelligence during a deal.
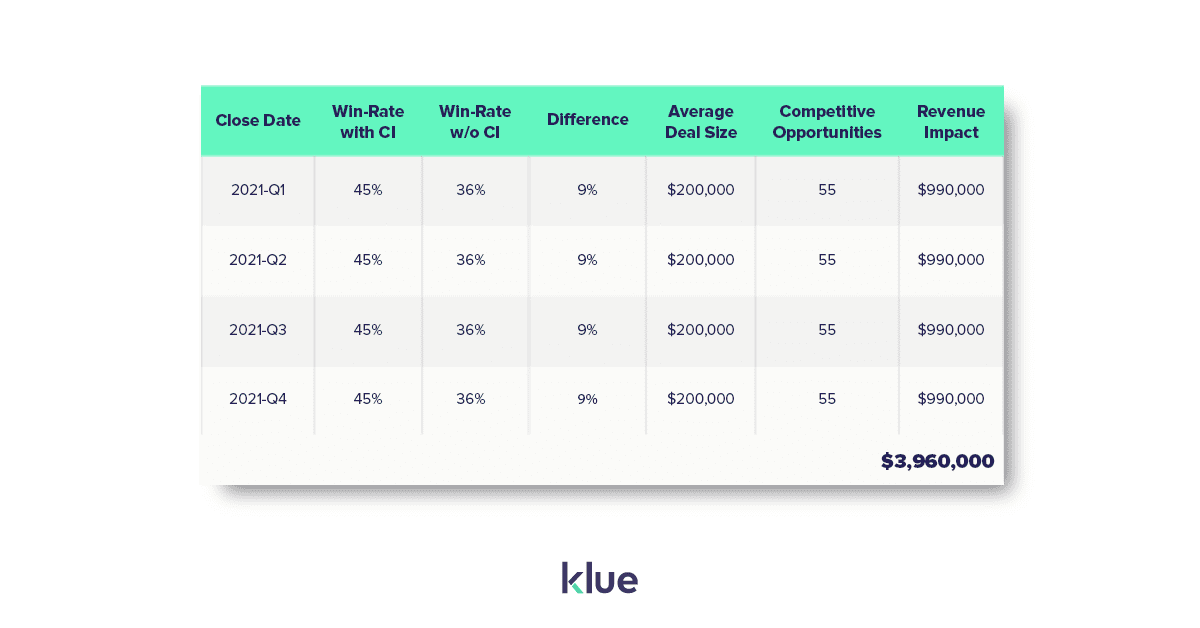

Now, that’s a number that gets attention.
People give a budget when they have a pain that needs to be solved. By positioning the impact of the revenue lost by teams who don’t use your competitive intel, you’re more likely to get winces from execs and a demand for the problem to be fixed.
These reporting metrics serve as a far clearer indicator of your program’s revenue impact than just content consumption or general win-rate improvements.
“The Sales Impact analysis helped us measure changes to Win Rates and Average Deal Duration. The results were very positive right from the beginning, so this helped us get executive buy-in early on,” said Patty McDonald, Global Solution Marketing Director at Symphony RetailAI.

Data is impossible to ignore. When you’re able to report on the quantitative impact your competitive program has had on revenue, you’ve taken out the guesswork for executives.
Now you’ve got a stronger leg to stand on to get more resources directed to your program and louder support from the most influential people in the company.
Now, not all programs are at a stage where they can tie an exact dollar amount to their competitive efforts or provide a detailed run-down of every competitor in their market. That’s OK.
But without any KPIs or reporting metrics in place, competitive enablement programs are doing themselves a disservice.
Start proving that the blood, sweat, and tears you’ve put into your competitive battlecards isn’t all for naught.
There are qualitative and quantitative metrics that you can start using today that will legitimize the output of your program and drive the competitive strategies that you’ll take on next.


Competitive Enablement
Product marketers conducting competitive research are drowning in reviews, reports, and messy notes. Here's how Klue's AI foundation will help you complete this analysis in seconds, not weeks.


Competitive Enablement
The topic of Large Language Models (LLMs) has a lot of confusion. Here's what you need to know about how Klue is working with them.

Let’s do it. Tell us a bit about yourself and we’ll set up a time to wow you.
Let's do it. Tell us a bit about yourself and we'll set up a time to wow you.
XLet's do it. Tell us a bit about yourself and we'll set up a time to wow you.
XSubscribe to get our latest AI functionality and news in your inbox.
XOur Buyer Pulse feature, set to launch in Q2 2024, offers valuable insights into the factors influencing buyer decisions in your pipeline. By signing up for the waitlist, we can better gauge interest and proactively engage with you to streamline the setup and integration process before the feature becomes widely available.
X