Klue Compete
The Competitive Enablement Platform
Learn More
FIND OUT MORE >


If you’re not conducting win-loss analysis within your organization, then you’re probably leaving winnable deals on the table.
Running win-loss analysis and sharing these results on a quarterly basis is the best way to present competitive intelligence to your executive team so that they have a clearer picture of the market, how you’re performing within it, and the short and long-term strategies you should make to win more.
In this blog, we’ll dive into how to best use our win-loss analysis template so that you can organize the mountain of information you get from win-loss interviews, CRM data, and internal deal notes and surveys. Then we’ll look at how you should deliver these insights to your executives.
One note before completing your win-loss analysis template. make sure you’re first going to the individual leaders of different departments and asking:
You need to tailor your findings to the questions that they need answered. As such, in order to maximize the value of win-loss analysis, your template should be tweaked pending on the audience you share findings with.
Let’s jump in!

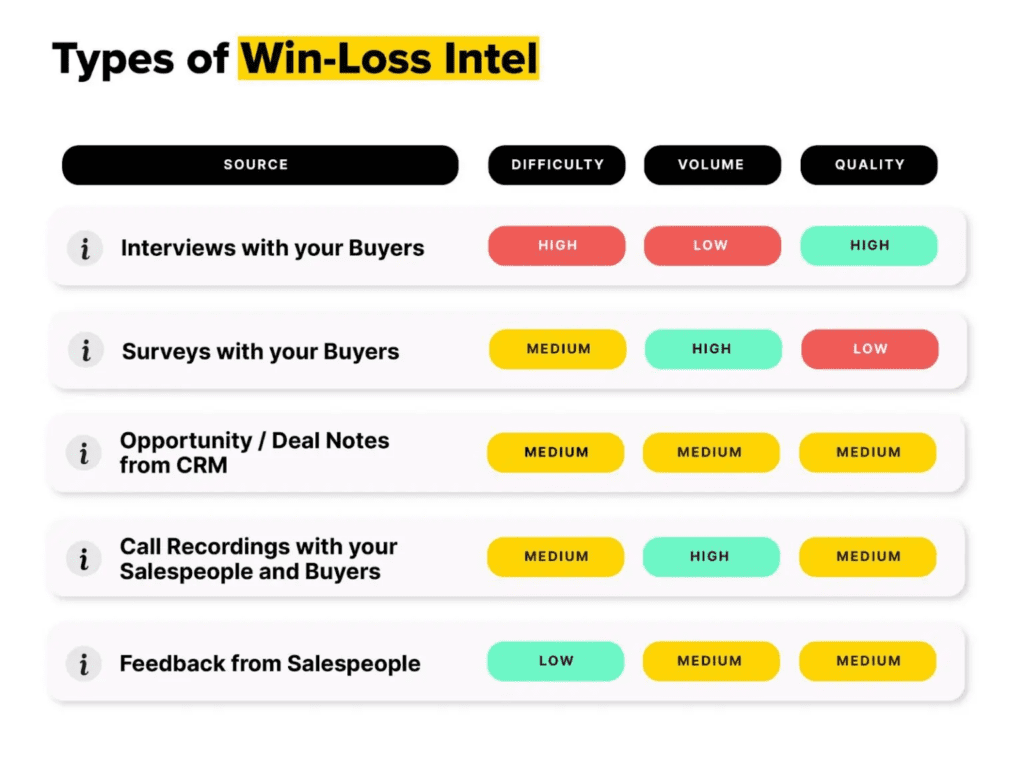
You likely already have plenty of win-loss data at your disposal.
There’s the post-mortem buyer feedback from the win-loss questions you’ve asked after a deal closed, the quantitative data and deal notes that your competitive platform can bring in from your CRM, and of course internal intel from sellers.
Now it’s time to go digging for the needles. That’s what competitive professionals do best.
If you’re looking to learn how to better collect win-loss data, check out Ryan Sorley’s, CEO and Founder of DoubleCheck Research, best tips for nailing a win-loss interview.
The juiciest qualitative win-loss data comes from buyer interviews. But they also produce a lot of unstructured data that requires analyzing. Here are three ways you can consolidate the findings from hours of these interviews:
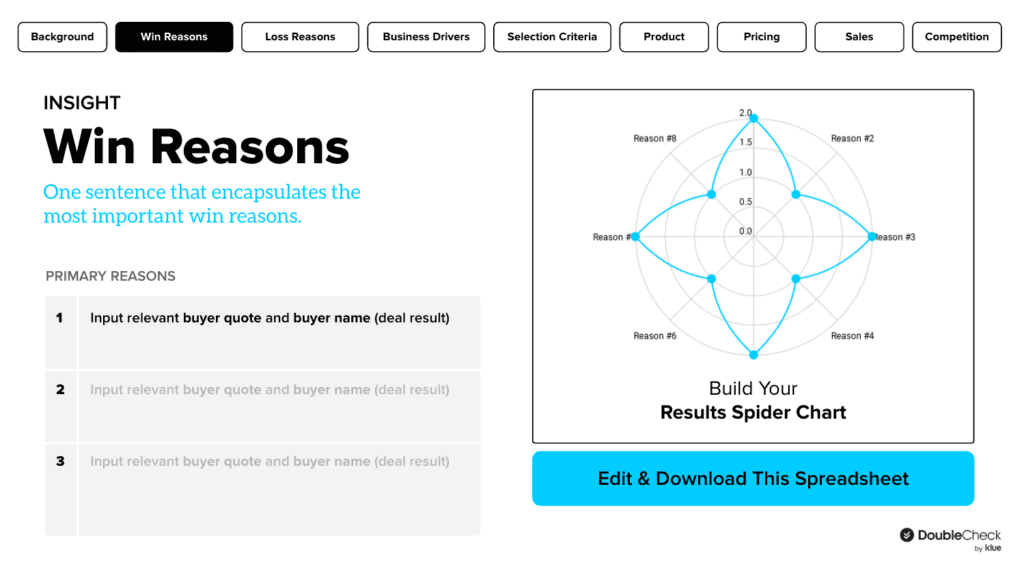
(Check out our win-loss analysis template if you want to quickly pull those trends into a shareable chart.)
Your sales leader looks at this and says ‘hey these are results from 15 interviews, but we had 100+ deals last quarter. The sample size is too small!’.
They’re not (entirely) wrong.
That’s why Jennifer Roberts, Director Marketing Strategy at ServiceTitan, says that she overlays these findings with the quantitative data from her CRM during her presentation at Compete Week.
“Win-loss analysis allows you to navigate different stakeholders who think that our competitors are different, or that an ankle-biter is worth spending all of your resources on versus a legacy competitor who’s been stealing from you regularly.“
It allows you to focus on the top competition and quantify why they’re the top competition. You can mix in the qualitative with the quantitative.”
A great way to overlay quantitative data for executives is by calculating and presenting the Competitive Revenue Gap that you’re losing to each competitor.
The ones lining their pockets most with your business are the ones your company should be focusing on.
Now we get to the fun stuff. It’s time to tell a story with our data.
Communication is an art, so bring your own flavour to the table here. But remember, this has to be memorable. For example, Justin Topliff, the Compete Lead at Highspot, takes inspiration from Talladega Nights when narrating Highspot’s competitive story.
You might not be a motorhead like Justin. That’s fine. But here are the two things that you must include in your win-loss analysis template to capture your audience’s attention and tell an effective story.
If you’re in product marketing and own win-loss, storytelling is already in your wheelhouse! This is one of the most unique opportunities to align leadership across departments, build a clear strategy, and get the entire business rowing in the same direction.
You’re the person connecting the dots between the business.
Building a narrative also sets the expectation that win-loss isn’t just a one-off project but a regular staple of quarterly recaps. Having this programmatic approach to win-loss analysis where learnings (and new questions!) build upon each other each quarter is how to bring the most value to your business, Ryan Sorley said at the Winner’s Circle event hosted by the Compete Network.
“We believe in the value of ongoing research — being able to identify those shifts in the marketplace that you can react to and respond to. I love programmatic approaches, but we also believe in being agile… you should use the same questions each quarter because you want consistency to analyze the data, but some questions also have to shift from quarter to quarter with new topics coming up.”
If you’re familiar with us at Klue, then you’ve heard us preach these three words repeatedly when it comes to delivering competitive intel within the org.
Know. Your. Audience.
Win-loss analysis is no different. When your audience in this case is primarily executives, then you need to get to the ‘why it matters’ as quickly and clearly as possible.
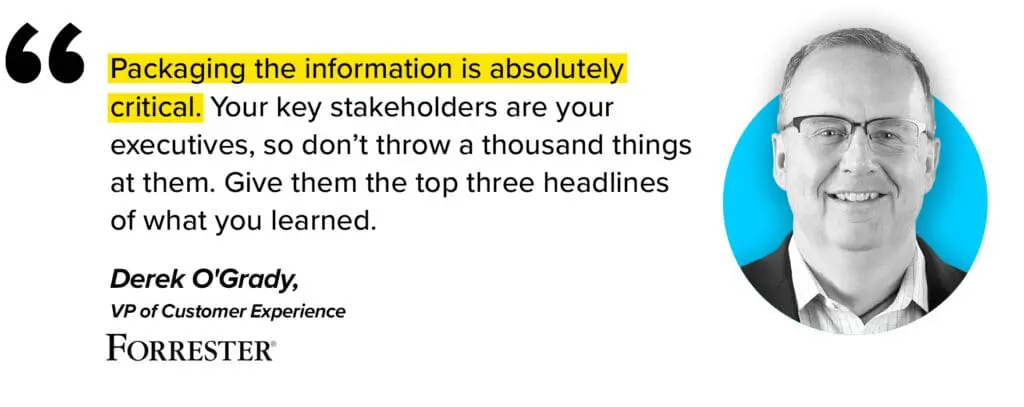
Remember, executives don’t have the time to read extensive reports or dig into thousands of charts. You need to get into the meat and potatoes, said Derek O’Grady, VP of Customer Experience at Forrester at the Winner’s Circle event.
“Packaging the information is absolutely crucial. Your key stakeholders are your executives, so don’t throw a thousand things at them. Give them the top three headlines of what you learned.”
One-size-doesn’t-fit-all when it comes to presenting your win-loss analysis summary with executives. As mentioned, you need to tailor findings to the questions and learning objectives they shared with you prior to your research.
However, here are some of the best sections that you should be including within your win-loss analysis template:
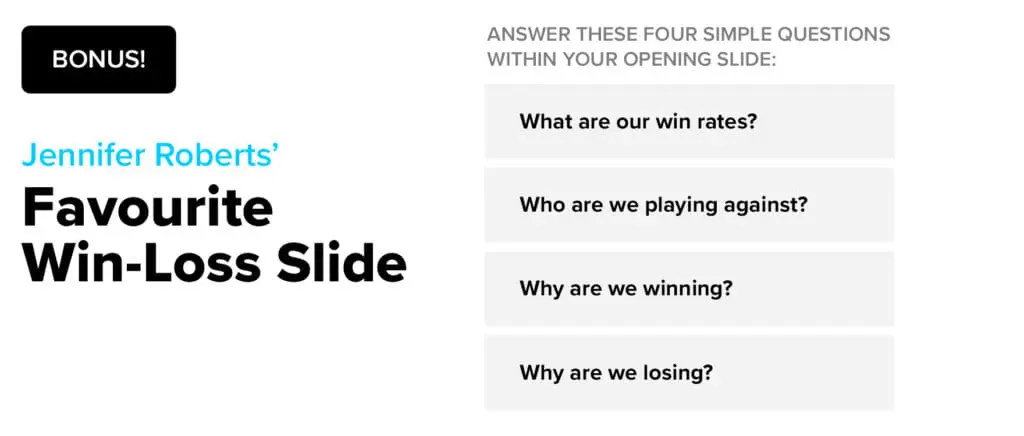
Jennifer Roberts has built three different win-loss programs in her career. Her favourite single slide to present to executive stakeholders answers four simple questions:
These questions anchor the entire leadership team, are simple to quantifiably track improvements over time, and guide the rest of the meeting.
“Use each question as a lever to track against consistently. Each quarter, execs now know this is coming. Then you can build on this over time, and get to the ‘why’ of each question,” Jennifer explains.
Learn how to bring win-loss data into Klue here
There you have it.
The sections, the strategy, and the storytelling needed to deliver win-loss analysis to your executive team.
Nailing this with our win-loss analysis template is your surefire way to deliver value at the executive level.
Peter Mertens, Director of Market Strategy at Sprout Social, credits presenting win-loss and the competitive landscape effectively to his executives as the catalyst for getting his work to the board level and catapulting his career.
“That was my, ’Holy crap, people are actually interested in what I’m pulling out, what the insights are, and how we can use that to make Sprout that much more successful in the marketplace,” said Peter during his appearance on Back Office to Boardroom on the Compete Network.
Let’s stop your business from leaving winnable deals on the table.

Competitive Enablement
The topic of Large Language Models (LLMs) has a lot of confusion. Here's what you need to know about how Klue is working with them.

Competitive Enablement
Product Marketing
If your competitive intel game is too strong for automation, too pure for data privacy, and too rebellious for accuracy — then Klue AI is probably not for you.
Let’s do it. Tell us a bit about yourself and we’ll set up a time to wow you.
Let's do it. Tell us a bit about yourself and we'll set up a time to wow you.
XLet's do it. Tell us a bit about yourself and we'll set up a time to wow you.
XSubscribe to get our latest AI functionality and news in your inbox.
XOur Buyer Pulse feature, set to launch in Q2 2024, offers valuable insights into the factors influencing buyer decisions in your pipeline. By signing up for the waitlist, we can better gauge interest and proactively engage with you to streamline the setup and integration process before the feature becomes widely available.
X